This Business Intelligence dashboard allows the user to track students majoring in specific Academic Plans, Majors (Organizations), Departments, or Colleges. Additionally, one can query for total university-enrollment. These reports can assist in many aspects of administrative planning.
- To gain access to this report, you must have one of the following roles
- If you have taken Student Records 101 or Student Central Advisor Center training and followed up on obtaining your security roles, you will already have one of the roles listed below.
- If you haven't taken one of those courses and you need to access this report, request FSU_SR_ENROLL_RPT_VIEW.
| FSU_SR_ENROLL_RPT_VIEW |
| FSU_SR_ENROLL_SUMMARIES_USER |
| FSU_SR_STU_PROG_PLAN_VIEW |
| FSU_SR_TERM_HISTORY_VIEW |
IMPORTANT! myFSU BI is supported on the following browsers:
- Chrome: 12.x-29.x, but not on the latest version of Chrome-30.x
- Firefox: 17+, 10+, 6+, 3.5+
- Internet Explorer (IE): 7.x-10.x
Navigation
Go to my.fsu.edu>Faculty and Staff tab. Under myFSU Links, click the BI icon. On the BI main page, go to Dashboards>CSW-Enrollment>Student Demographics
![]()
Steps
1. Following the navigation as described above brings you to the dashboard in this image:
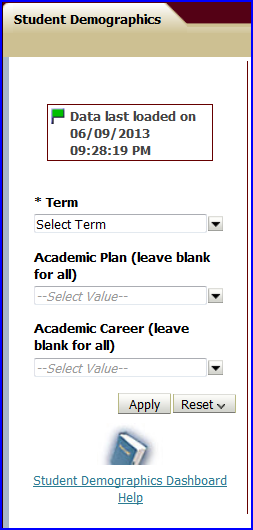
2. Select a Term, Academic Plan/s, and an Academic Career as necessary.
NOTE: If all plans or all careers must be captured in the report, in the Academic Plan and/or Academic Career drop-down box/es leave the field blank.
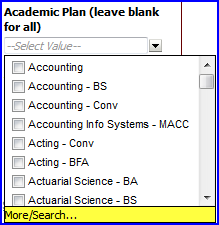
3. If the required value does not appear in the Academic Plan drop-down box, click the Search option. The Select Values dialog box appears.
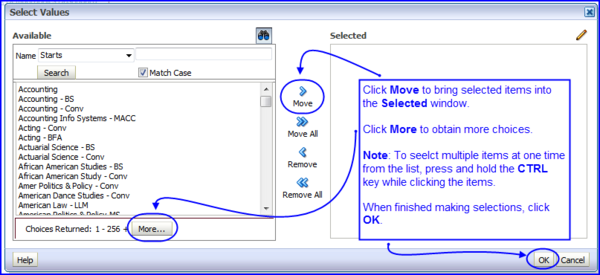
4. The dashboard with various Chemistry plans selected. Click OK. You are returned to the dashboard.
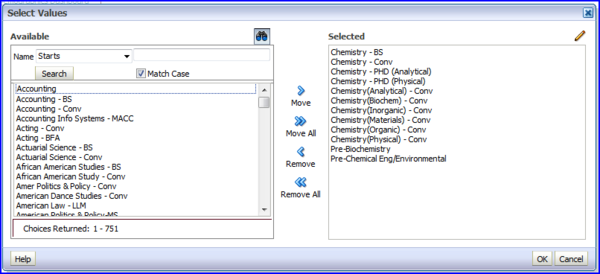
5. Click Apply. If the category in the Summary drop-down box was not changed prior to running the report, the results are displayed according to Summary-Academic Career.

6. If results should be filtered by another criterion (or metric), click the Summary drop-down box's arrow to display choices.
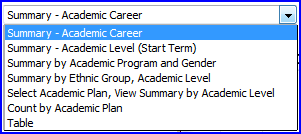
You can choose to constrain your summary data by applying the following metrics:
- Academic Career-generates a report reflecting students' Career Level-for example, undergraduate.

- Academic Level-generates a report reflecting students' year level at the beginning of the term set in the dashboard's Term drop-down box-for example, freshman, sophomores, and so on.
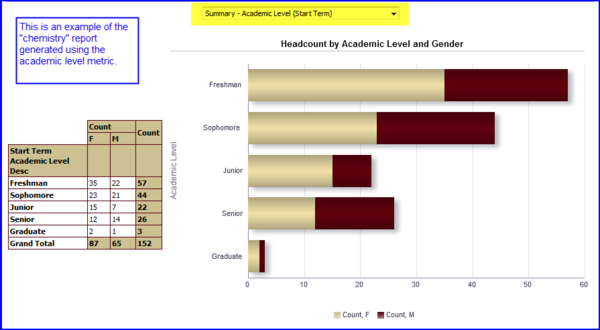
- Academic Program and Gender-generates a report reflecting students' gender by degree level-for example, bachelors, masters, or PhD.

- Ethnic Group, Academic Level-generates a report reflecting students' ethnicity by year level at the beginning of the term set in the dashboard's Term drop-down box-for example, freshman, sophomores, and so on.

- Select Academic Plan, View Summary by Academic Level-generates a report reflecting students' level per plan. Select specific academic plans from the Academic Plan Desc. drop-down box.

- Count by Academic Plan-generates a report reflecting students' plan or intended major plus the degree level sought.

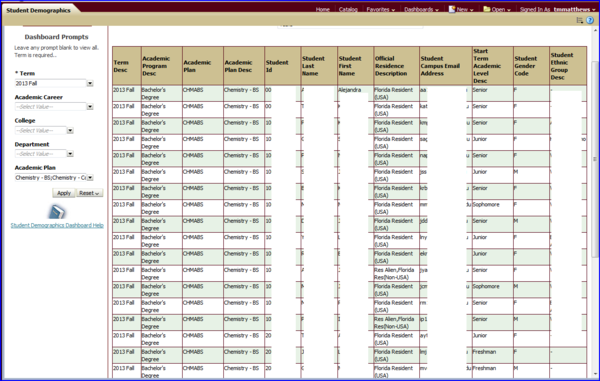
- Table-generates a report reflecting all of the summary metrics for the Term, Plan, and Careers chosen in the dashboard.
NOTE: The table view does include the students' campus email addresses. One cannot email from within BI, however.
To Export to Excel
1. To export the table to Excel, click the Export link at the bottom of the page. An Export menu appears.

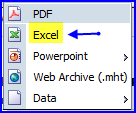
2. Click the Excel option. A dialog box appears asking if you want to open the file or save the file.
3. Choose Open with Microsoft Excel if you want to immediately view the file. Choose Save File if you would like to rename the file with an appropriately descriptive name before viewing it.
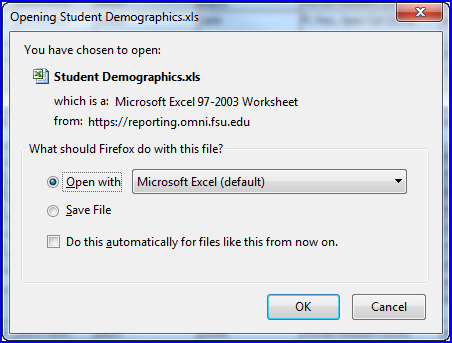
4. You may get this warning:

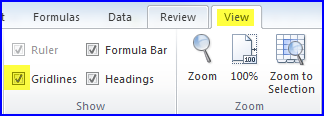
5. If so, click Yes. The Excel file opens. If the grid lines are not visible and you would like to turn them on, click the View tab and select the Gridlines check box.
NOTE: For more information on setting up your spreadsheet, see the FAQ section (scroll about halfway down the page) of the How To Run Queries and Create Excel Reports topic. Information on browsers can be found at Browser Settings-Tips & Tricks.
